Chartbrew - Client reports for your team and clients
About
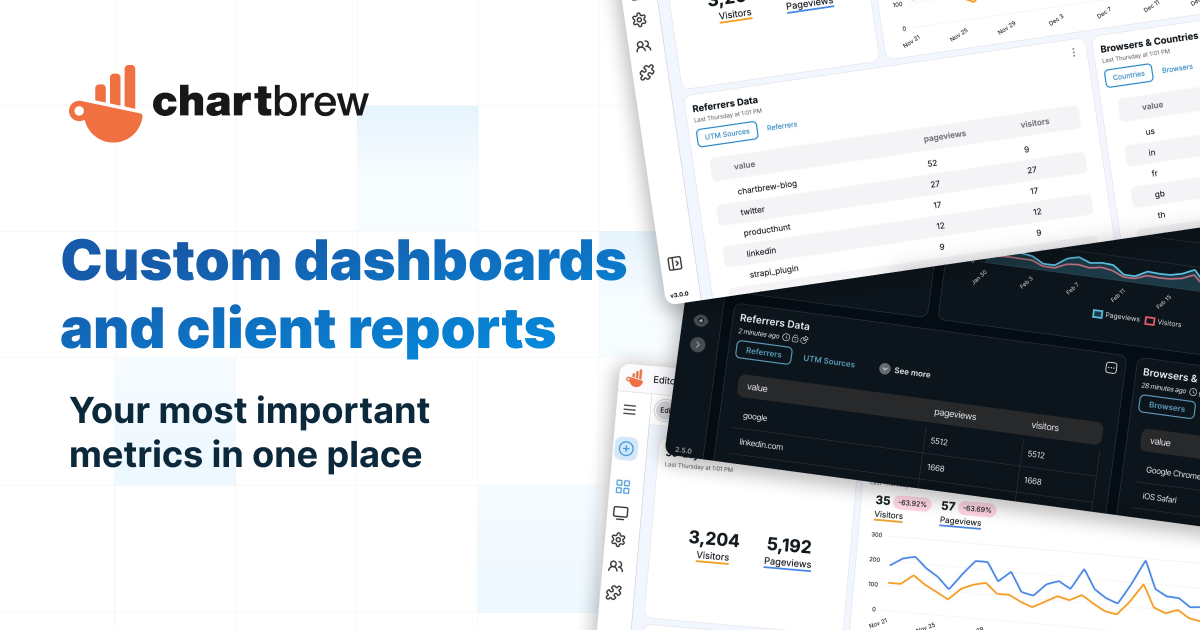
Chartbrew is a powerful tool designed to help teams and businesses create beautiful, live charts and custom dashboards from multiple data sources, making it easier to visualize key performance indicators (KPIs) for both internal teams and clients. This platform is particularly useful for companies looking to streamline their data analysis and reporting processes. By connecting all databases and APIs, Chartbrew empowers users to turn raw data into actionable insights.
Details
- Create dashboards and client reports in minutes
- Connect all your databases and APIs to create live charts
- Visualize data in custom dashboards
- Easy-to-use tools for creating interactive reports from all data sources
- Optimized for collaboration and speed
- Scale client reporting with templates
- Replicate dashboards for clients and customize datasets to match each client's needs
- Integrations with a wide range of data sources
- Easy setup and get started in minutes
#
Chartbrew is a game-changer for teams and businesses seeking to enhance their data visualization and reporting capabilities. With its user-friendly interface, extensive integrations, and focus on collaboration, Chartbrew makes it simple to create dynamic, branded reporting dashboards that delight both teams and clients